Why Are Businesses Loving This Dashboard?
If you're using Google Analytics to understand your website or app performance, you deserve clear, actionable insights. This Free Google Analytics Reporting Dashboard gives you instant access to a live, interactive dashboard with the exact metrics you need to make smarter decisions – no confusing jargon, no more waiting for manual reports or struggling with complex interfaces.
- Transparency: Completely transparent and unedited performance across key areas like traffic sources, user behavior, content performance, and conversion funnels.
- Real-time: Updated in real-time and always up-to-date with your current website and user behavior metrics.
- Interactive: Filter your data by key metrics, sort and view the data how you want, and export exactly what you need.
- Shareable: Hosted on a private URL your whole team can access this real-time report 24/7.
See the Google Analytics Insights You’ve Been Missing
Get Your Free Reporting Dashboard
Actual live data. No PDFs. No gimmicks. Just answers.
What's Inside Your Custom Dashboard
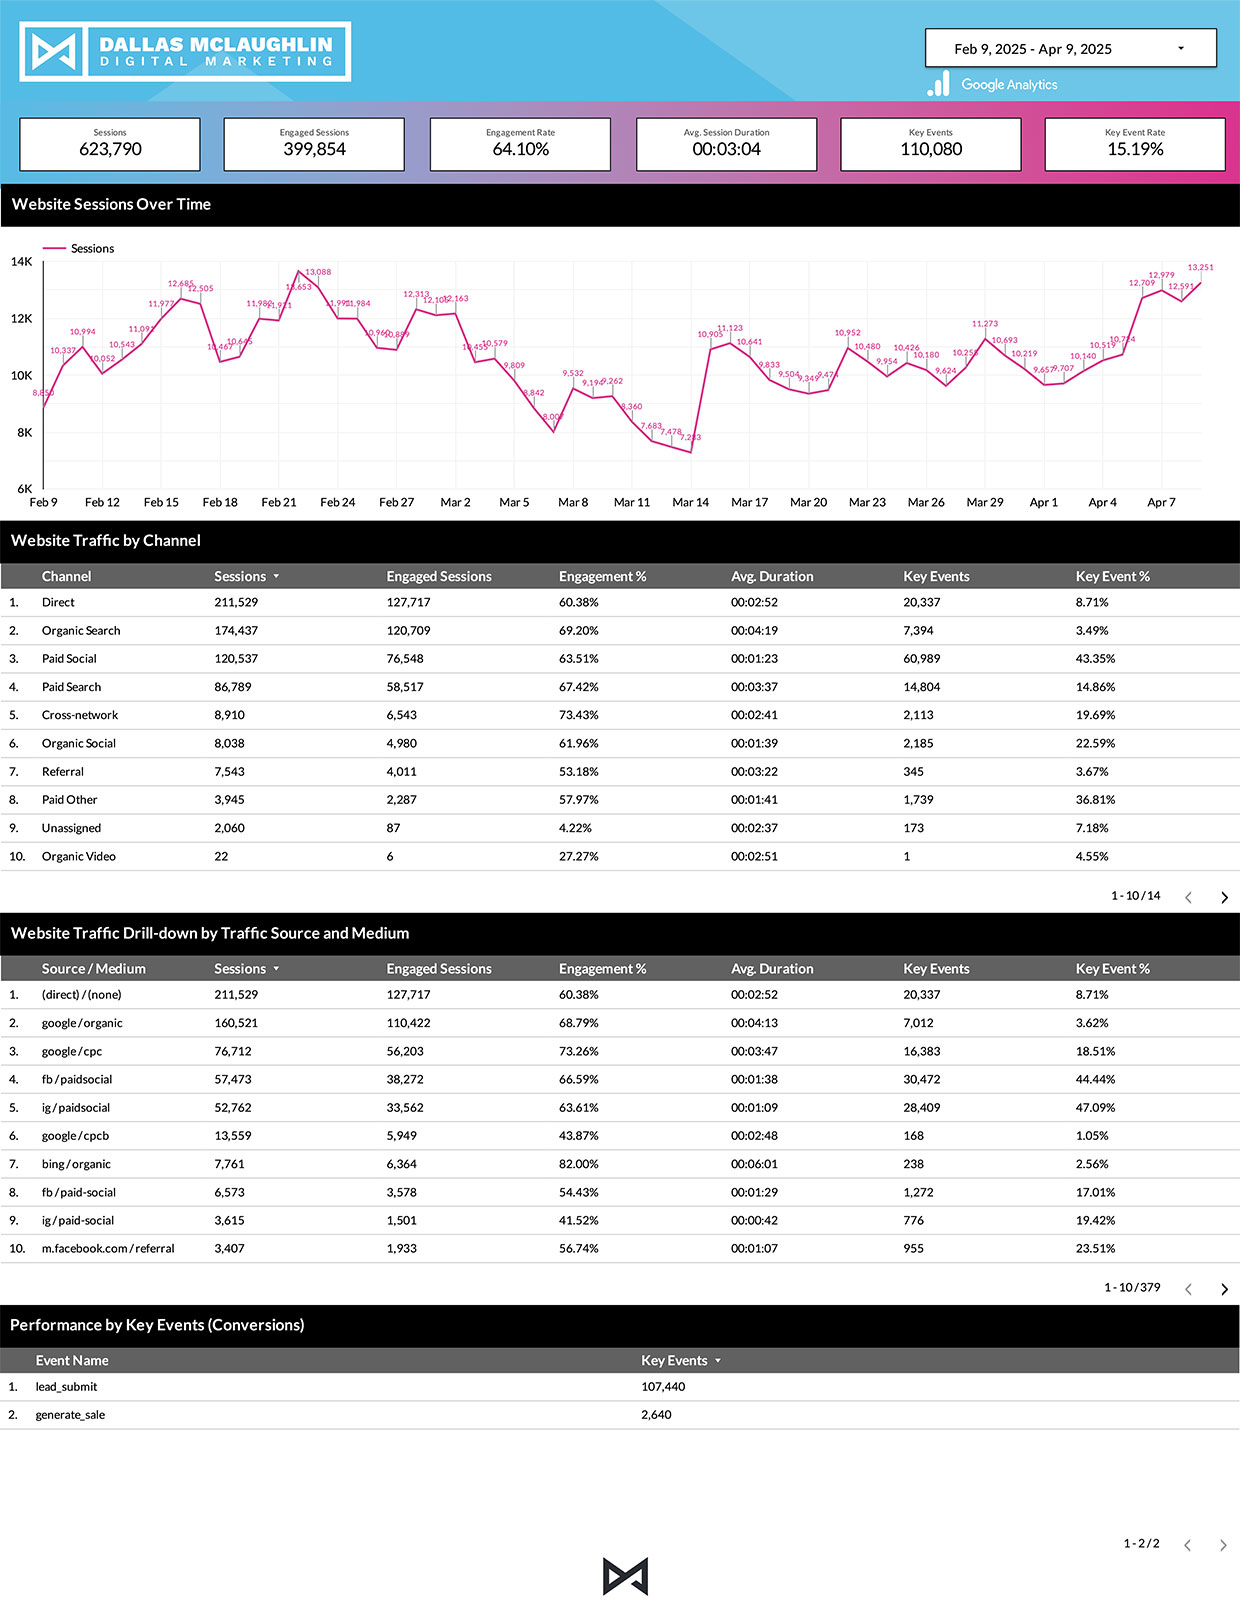
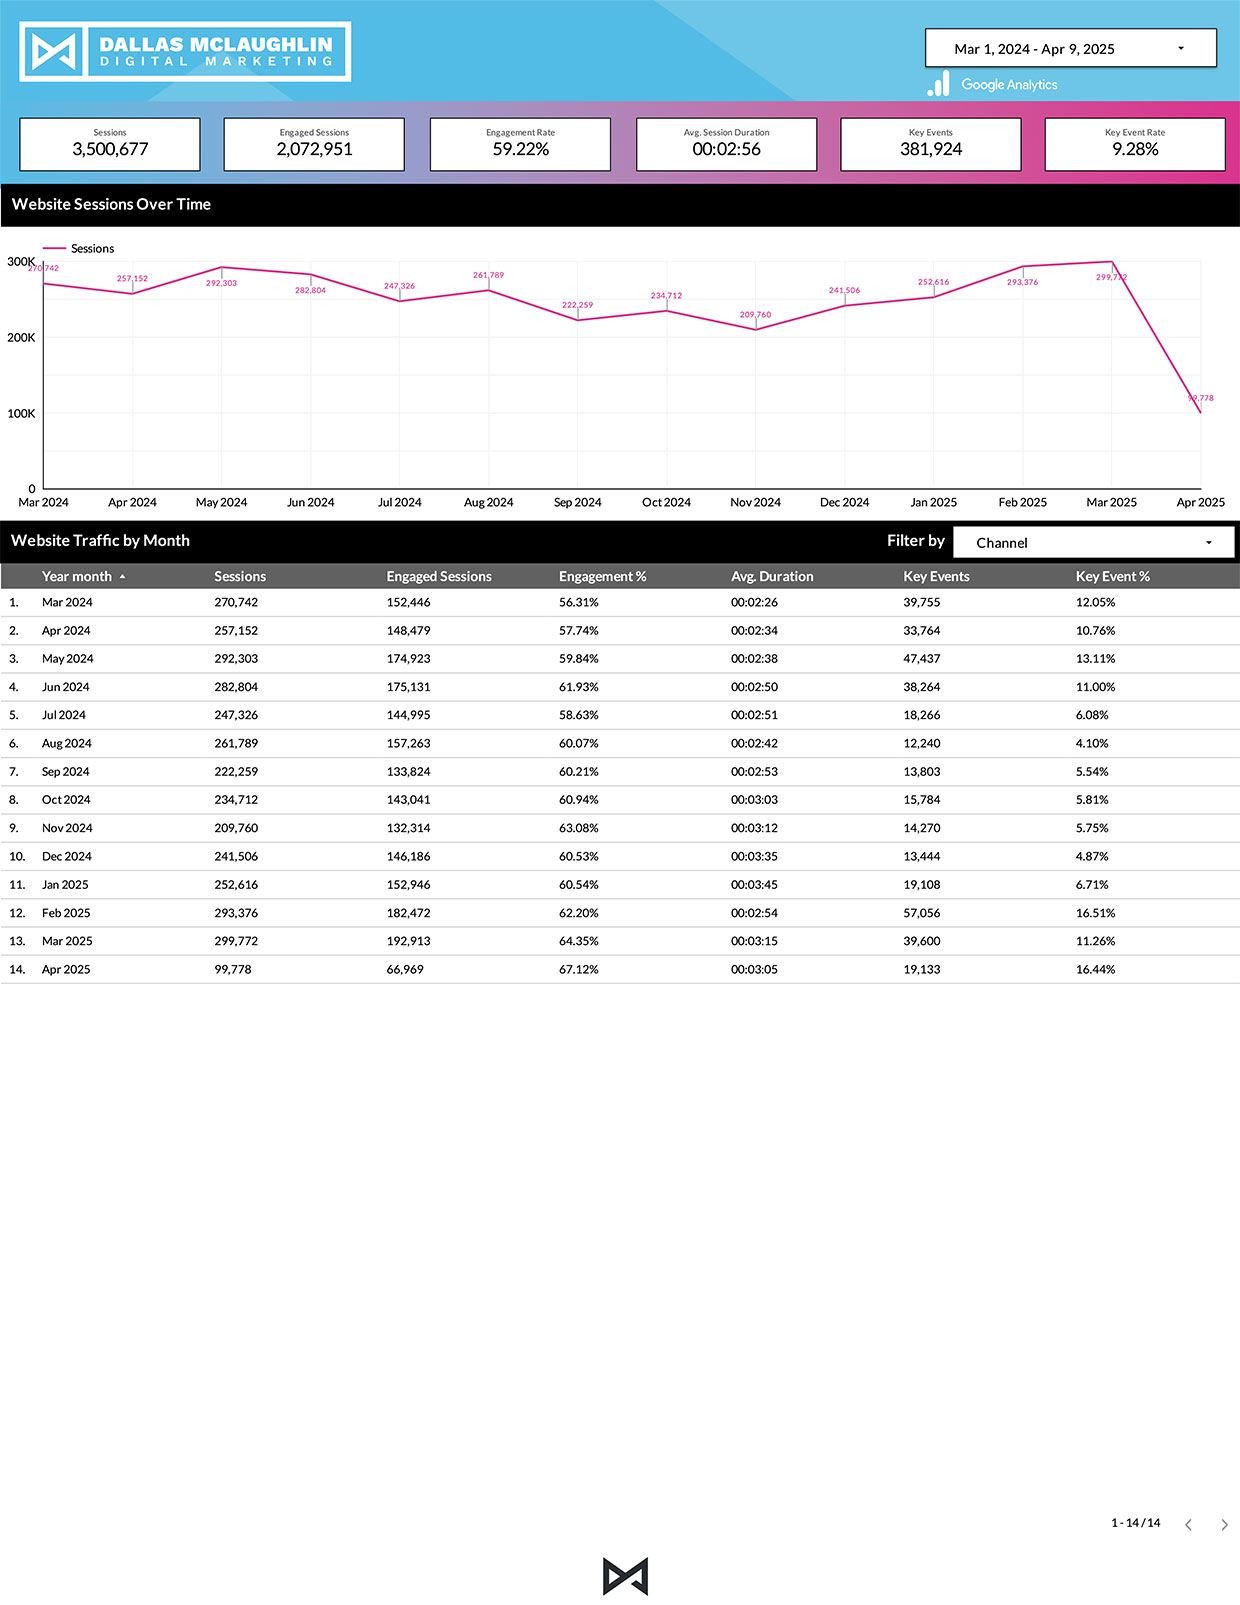
Review key website metrics like Sessions, Engagement Rate, Key Events (Conversions), and Avg. Session Duration. Analyze performance trends over any date range using interactive charts and tables, updated in real-time. Compare periods to understand growth and changes.
Instantly see which channels (Organic Search, Paid Search, Direct, Social, Referral, etc.) drive the most traffic and engagement. Drill down further into specific Source/Medium combinations (e.g., google/organic, facebook/paidsocial) to pinpoint your most valuable traffic sources.
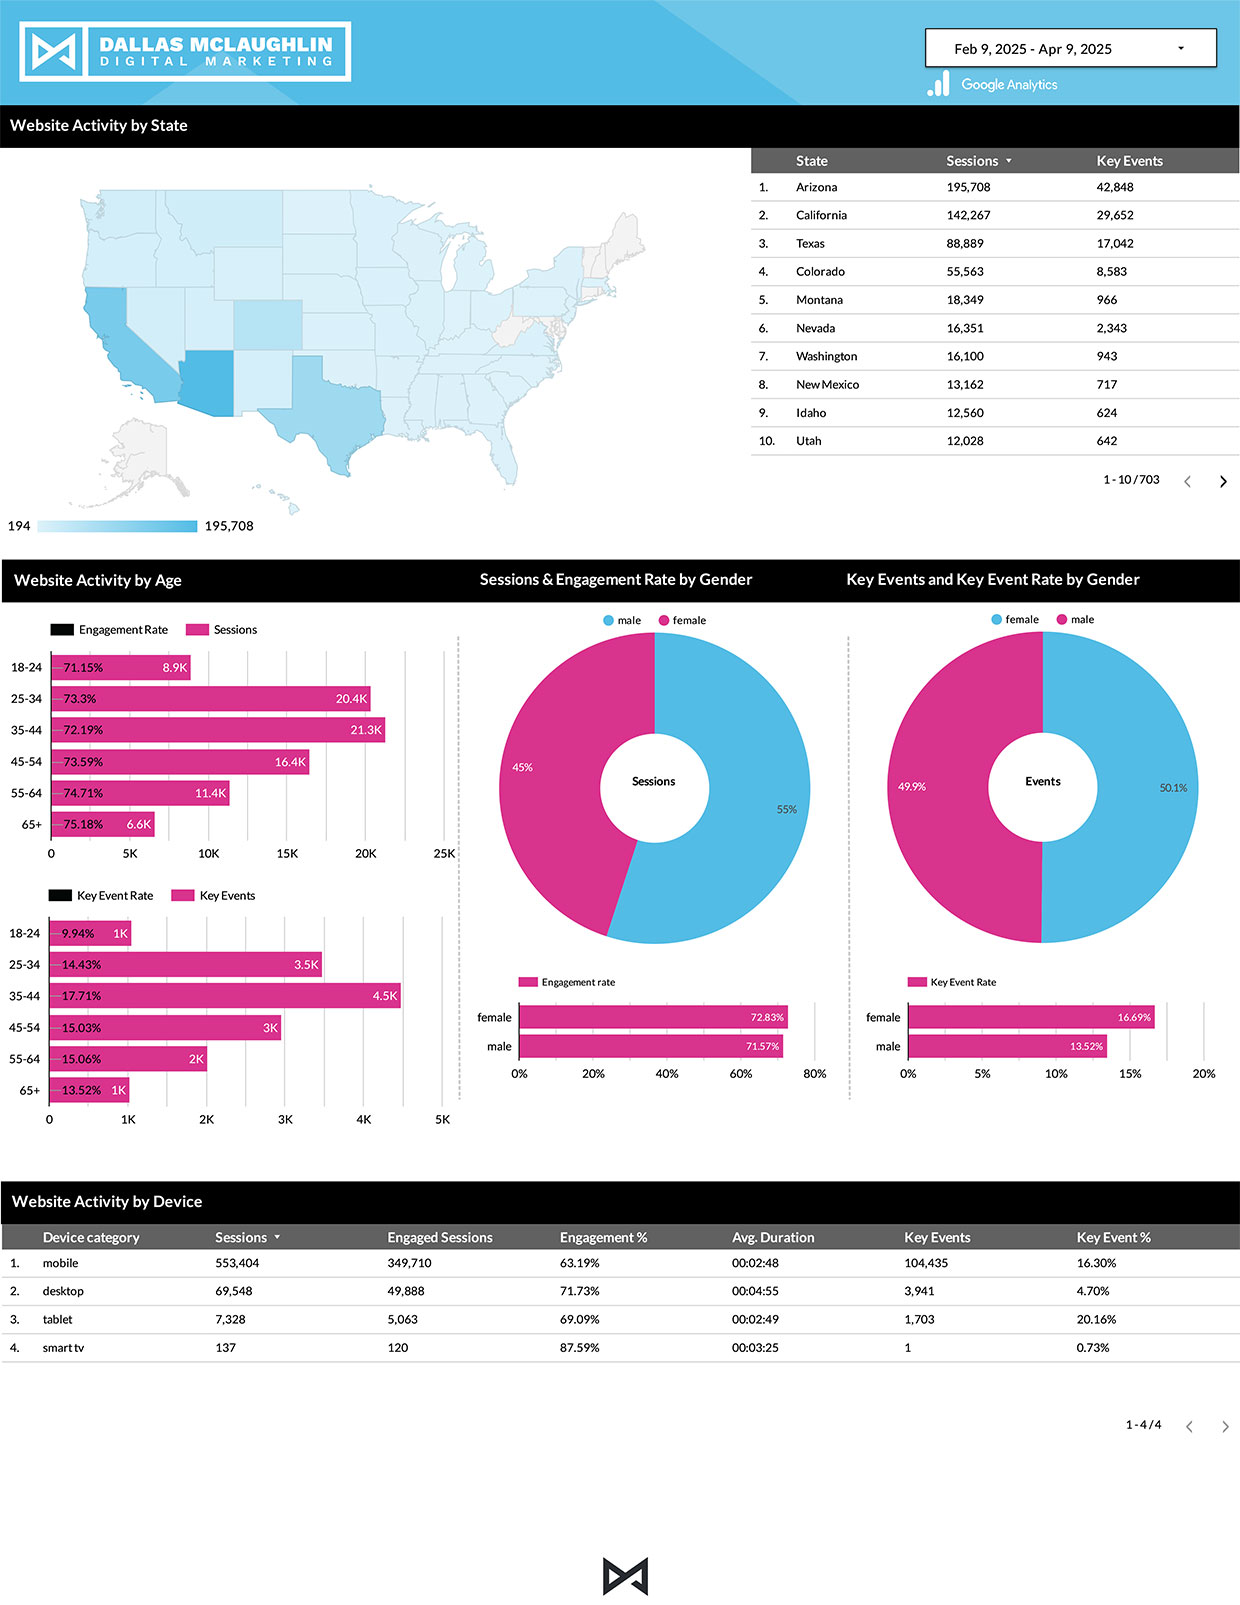
Understand how different user segments perform. Analyze Key Event Rates (Conversion Rates), Engagement Rates, and Session data broken down by Age, Gender, Device type (Mobile, Desktop, Tablet), Day of the Week, and Hour of the Day to identify your most engaged and valuable audiences.
Visualize your website activity across the United States with a state-level map and accompanying data table. Identify which states drive the most Sessions and Key Events (Conversions) to understand regional interest and performance.
Discover which pages on your site attract the most attention and which serve as key entry points. Review tables of Top Performing Pages based on Page Views and Entrances (Landing Pages), including metrics like Active Users, Avg. Duration, and Key Events tied to those pages.
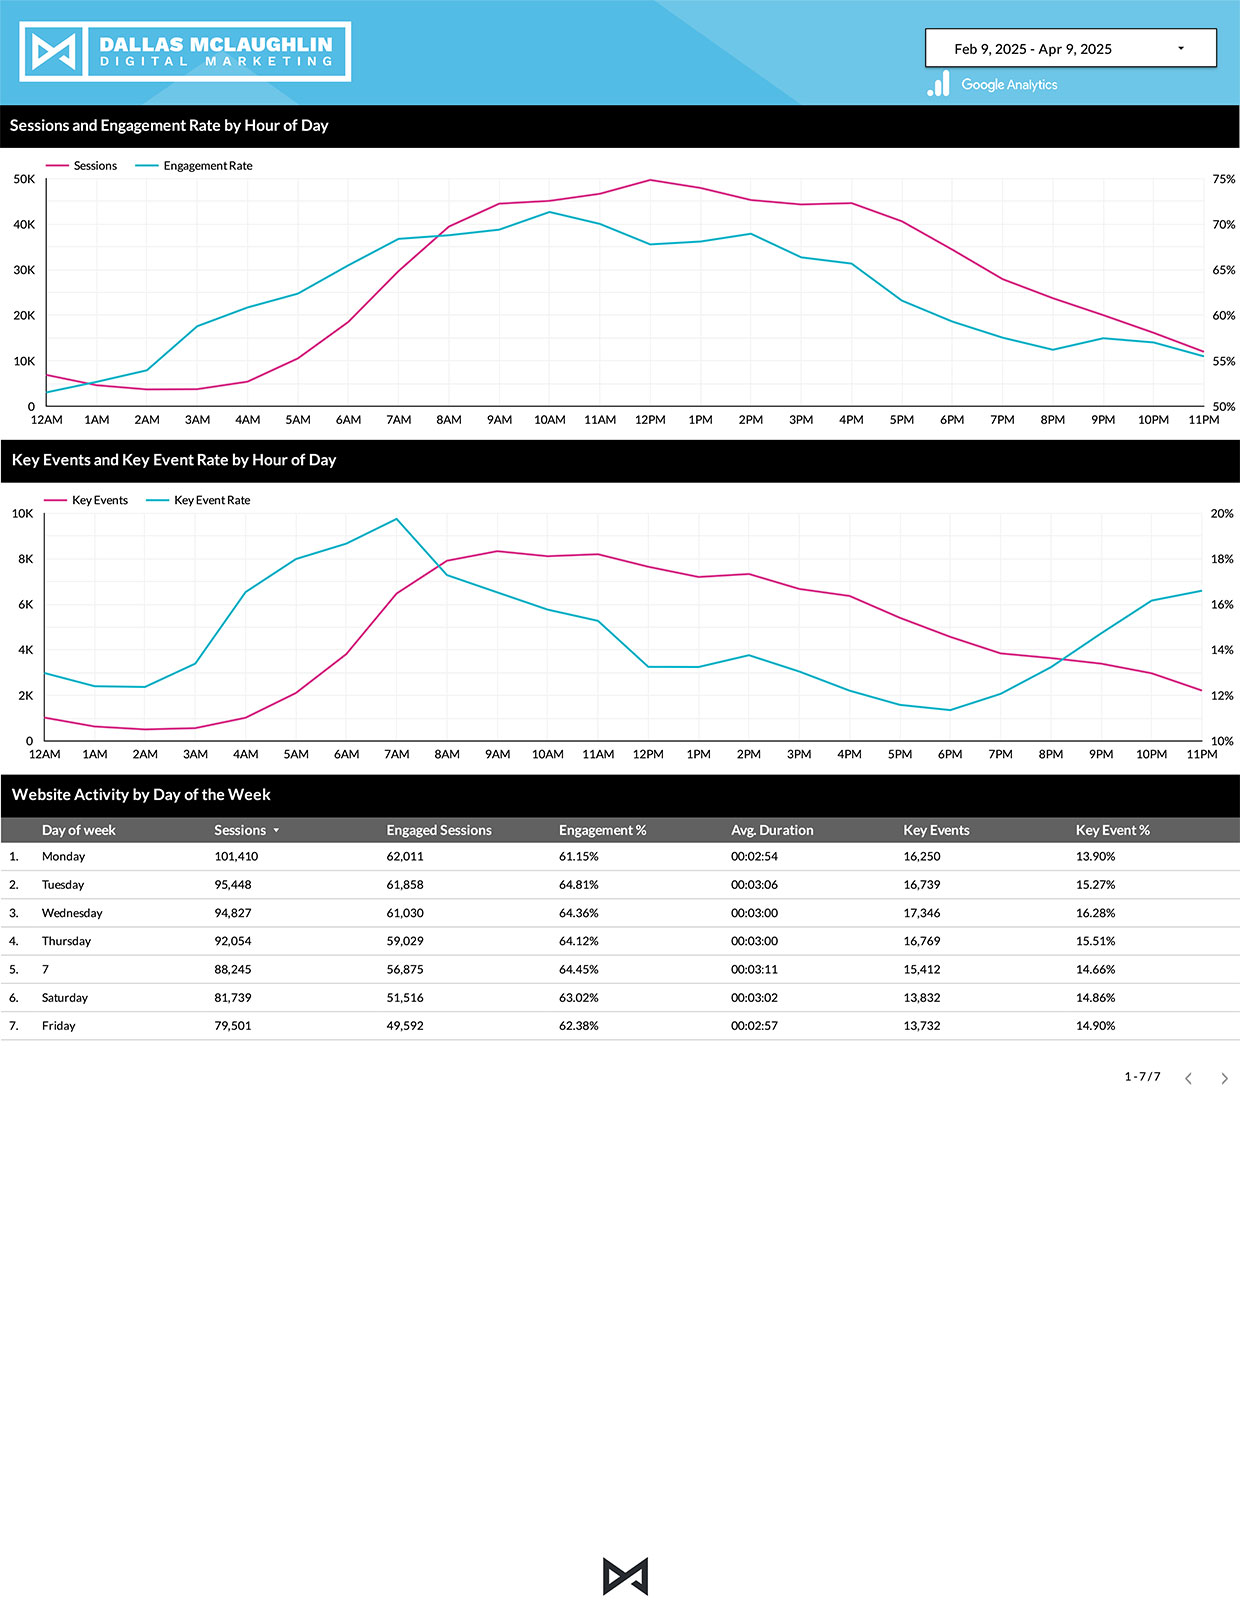
Identify peak traffic and conversion times by analyzing trends throughout the day and week. Review charts showing Sessions, Engagement Rate, Key Events, and Key Event Rate by Hour of Day and Day of the Week to optimize content timing or marketing efforts.
As your Google Analytics data is pulled into the dashboard and organized in real-time, you can quickly and conveniently export any table or chart data (often via right-click options in Looker Studio) for further analysis or inclusion in your own reports and presentations.