$750 of Value For Free

Unlock Your Free Google Ads Reporting Dashboard

Get a real-time, live dashboard that reveals how your ads are really performing – and where you're leaving money on the table.

Get Your Free Reporting Dashboard

No strings attached. Just one email with your dashboard link delivered in 1–3 business days.

Why Are Businesses Loving This Dashboard?

If you're already spending money on Google Ads, you deserve transparency. This Free Google Ads Reporting Dashboard gives you instant access to a live, interactive dashboard with the exact metrics you need to make smarter decisions – no fluff, no filler, no more waiting for your agency to send out-of-date reports.

  • Transparency: Completely transparent and unedited performance across campaigns, ad groups, keywords and audiences
  • Real-time: Updated in real-time and always up-to-date with your current performance metrics
  • Interactive: Filter your data by your key metrics, sort and view the data how you want, and export exactly what you need
  • Shareable: Hosted on a private URL your whole team can access this real-time report 24/7.

See the Insights You’ve Been Missing

What's Inside Your Custom Dashboard

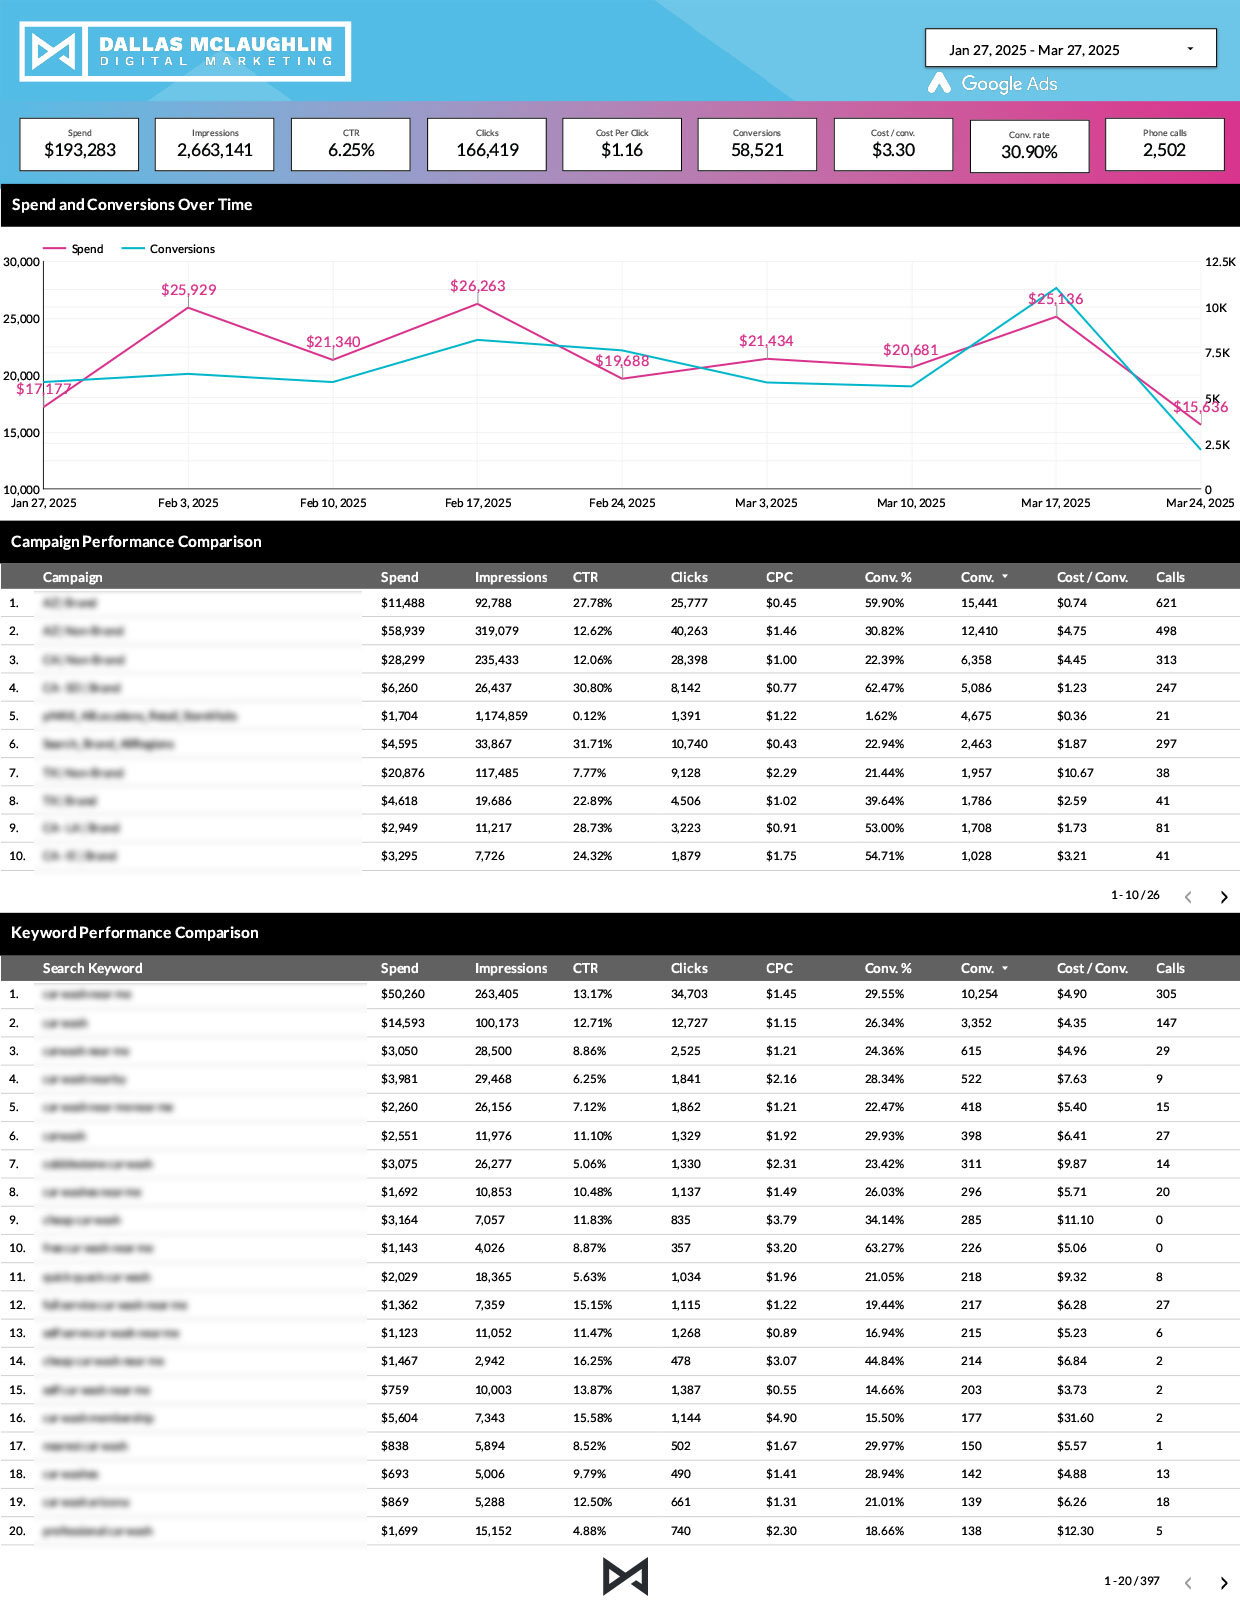
Review all of the included metrics by any date range - as far back as Google Ads data exists in your account. Compare date ranges, filter and sort period over period performance reports. All updated in real-time and on an ongoing basis.

Review performance metrics at the campaign level, review each individual ad group, and see every keyword your account is appearing for all in one dashboard.

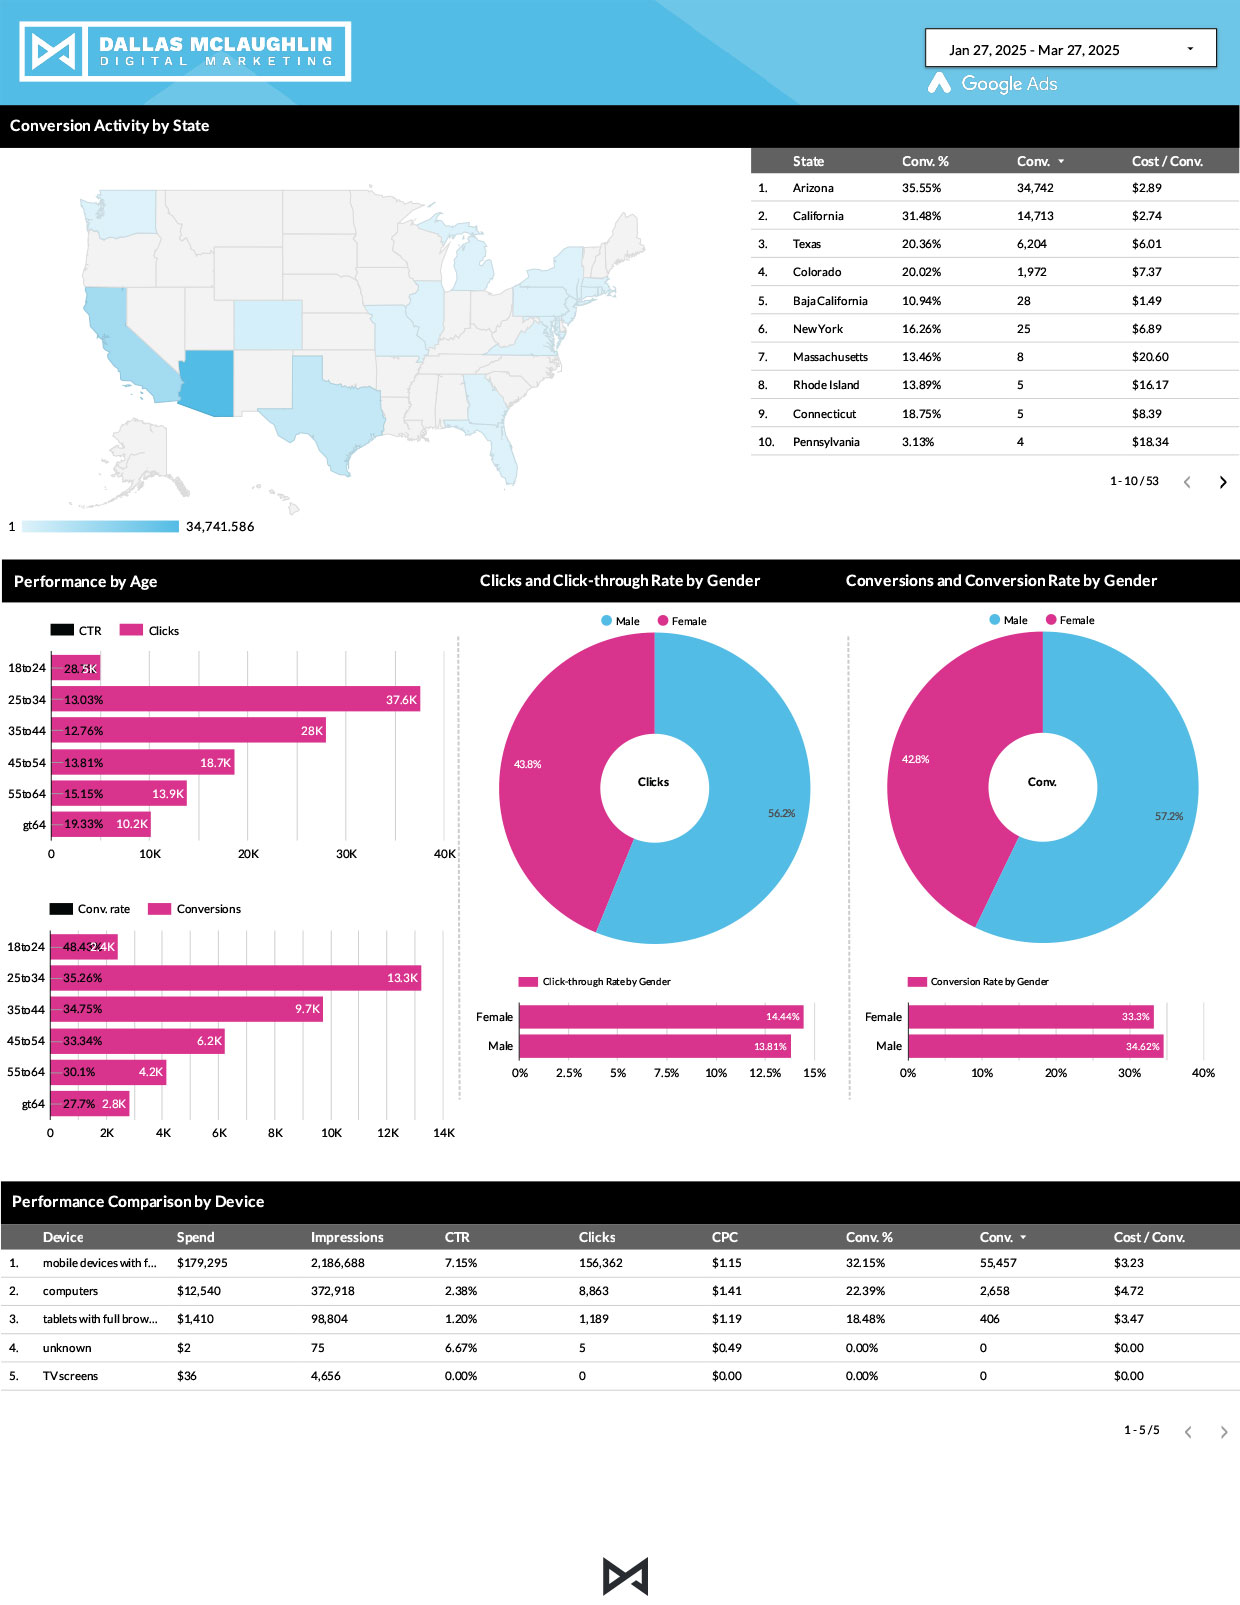
Review for detailed audience segements to identify top-performing cohorts, informing advanced bid adjustments that help reduce wasted ad impressions and increase your bidding against top-performers.

Review state and city-level conversion data overlaid on a United States map to help determine the best (and worst) places to invest your ad spend leading to increased efficiency.

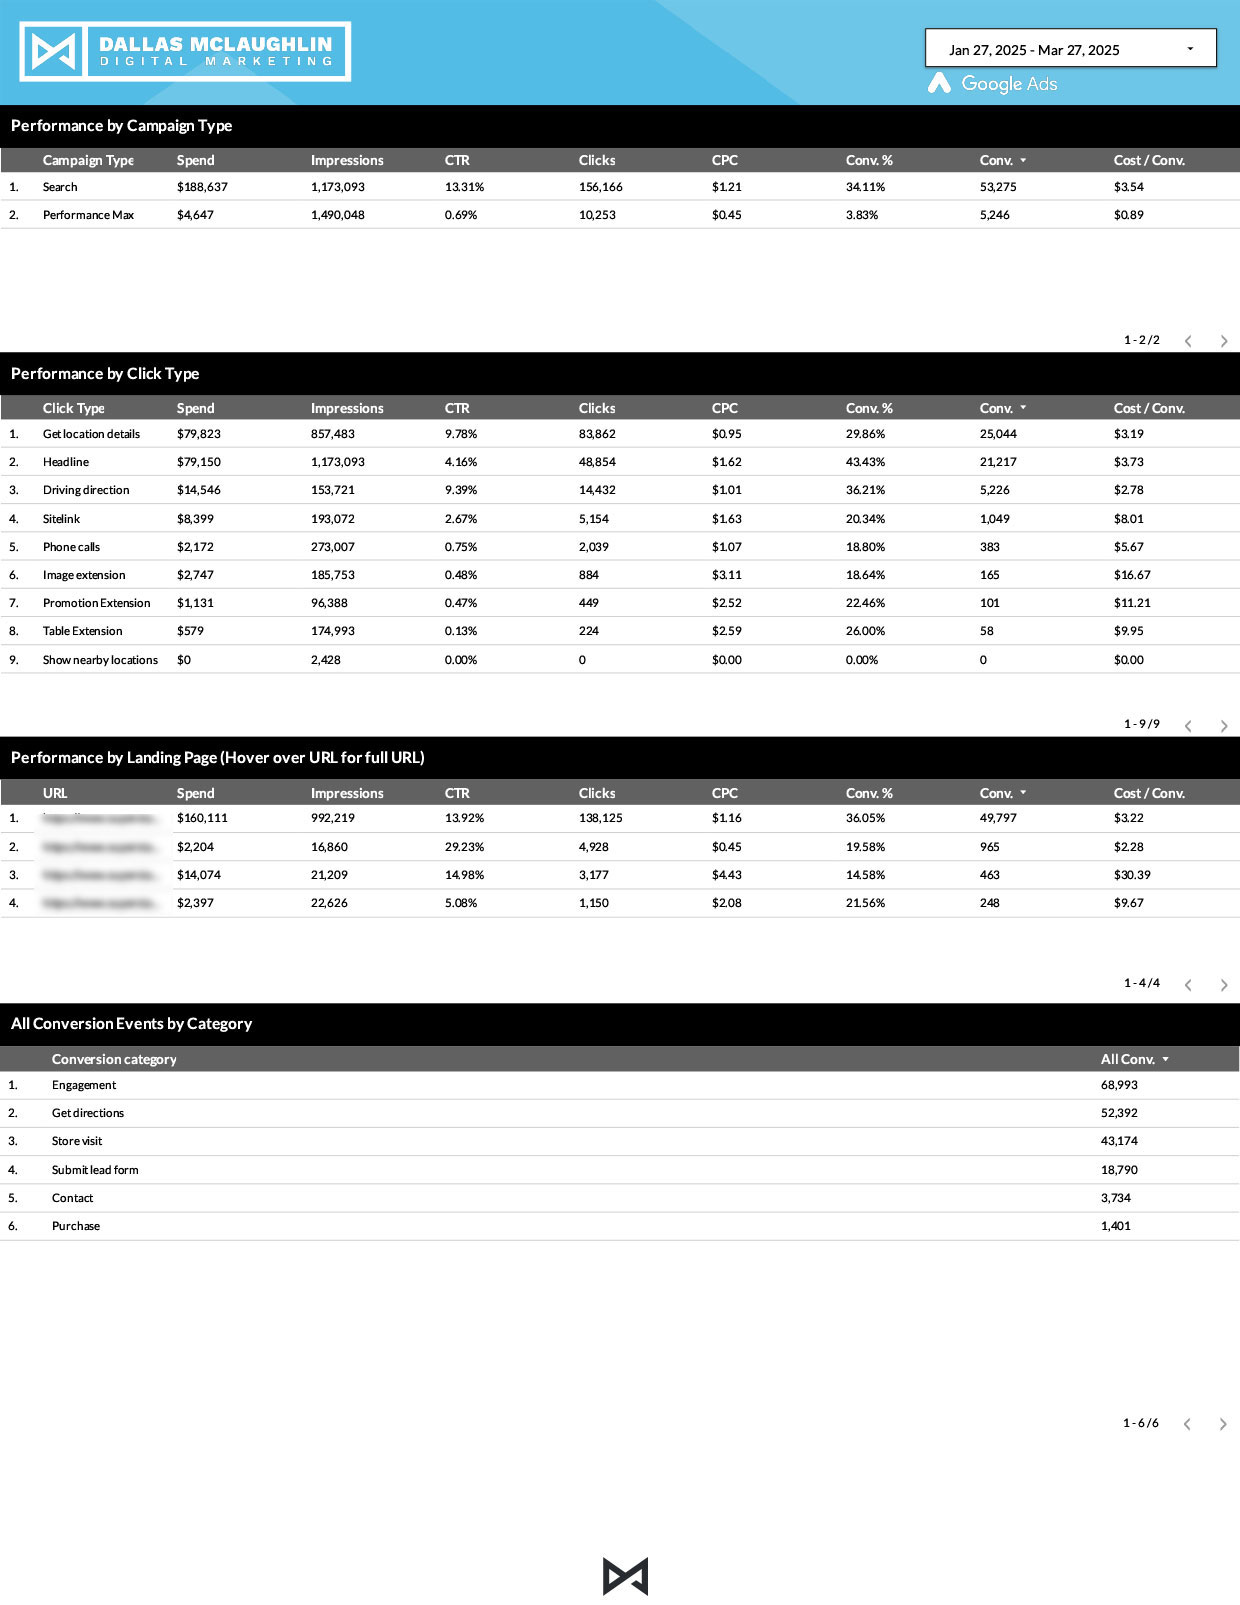
Running more than just search through your Google Ads account? Get a summarized view of how each campaign type is performing based on their respective objectives to see which campaign types need more or less investment.

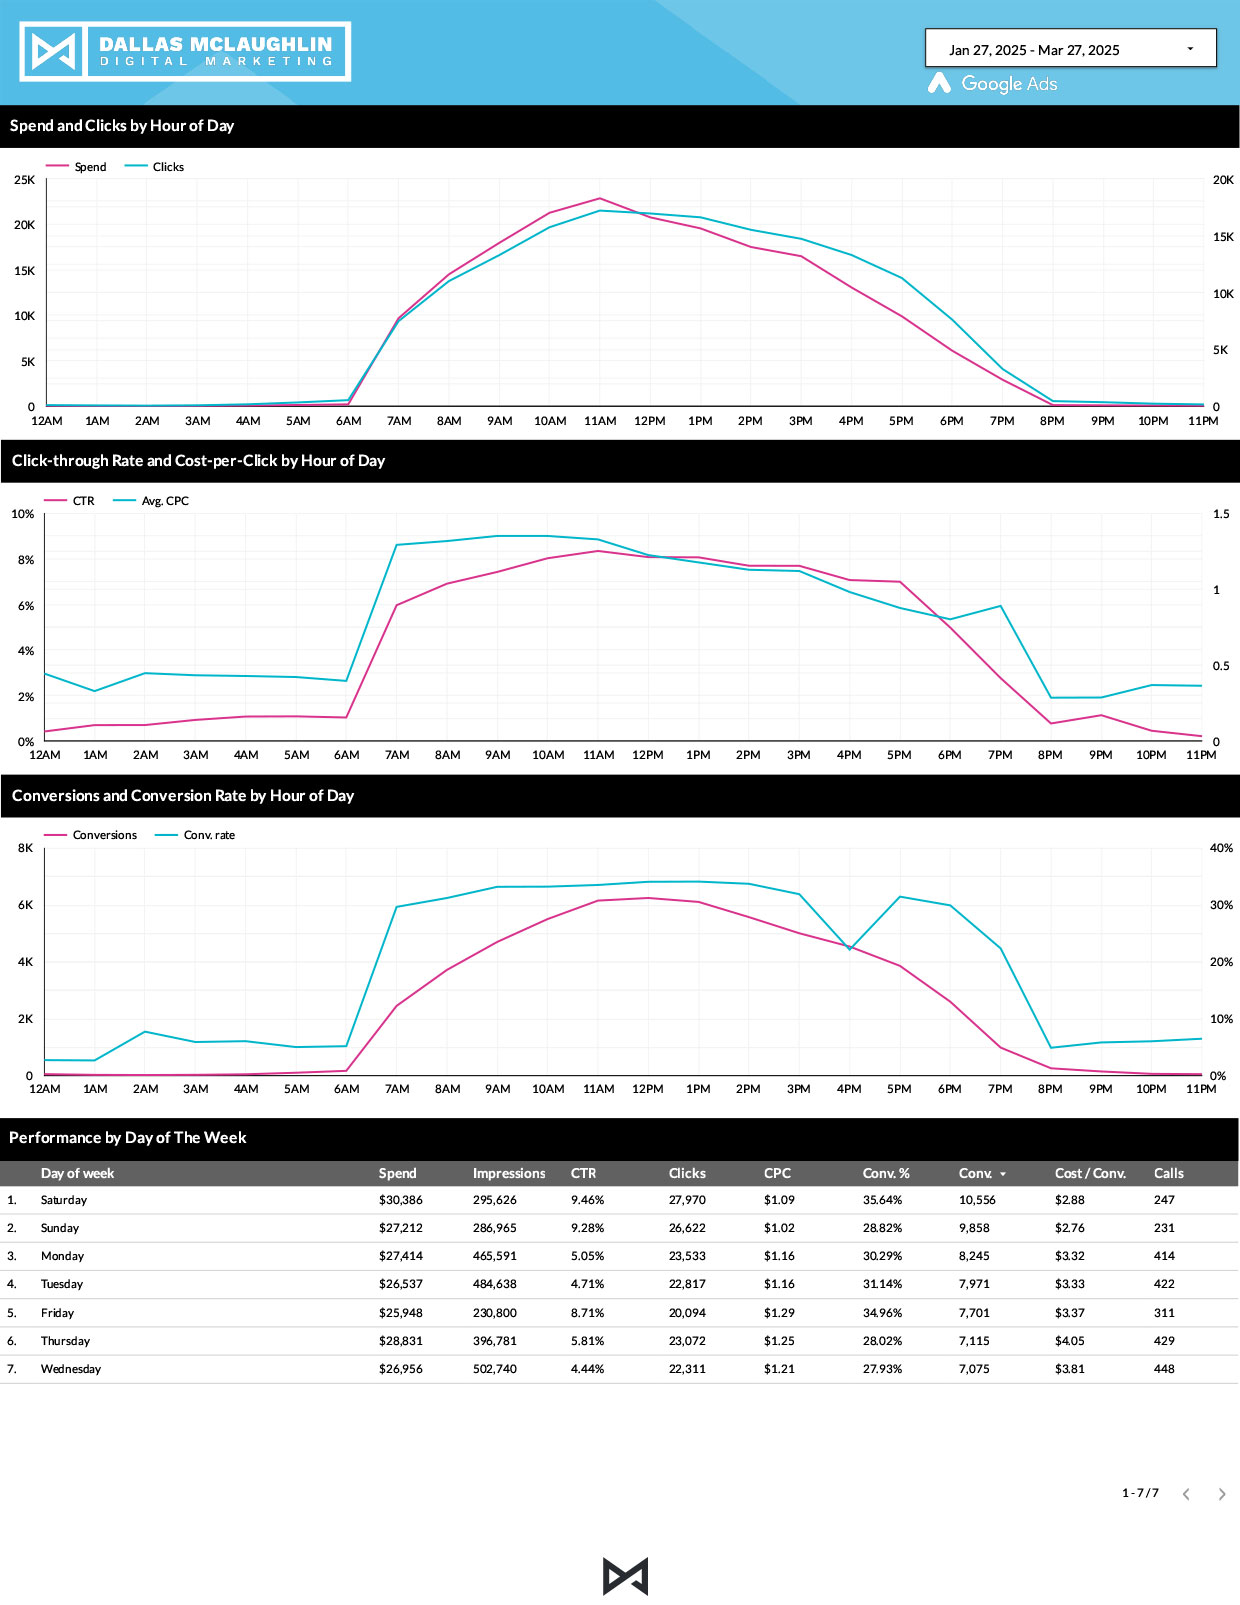
Review the correlation between Click-through Rates and Cost-per-Click trends overtime by analyzing charts comparing these metrics by hour of the day, day of the week, by device, by demographics and much more.

As data is pulled into the dashboard and organized in real-time, you can quickly and conveniently export any table into it's own .csv, .xls, or .pdf file for additional review or inclusion in your own reporting and presentations.

Get Started Setting Up Your Free Google Ads Reporting Dashboard

Once we complete the 30-second integration setup, we’ll deliver your personal live dashboard within 24 hours.

This field is for validation purposes and should be left unchanged.

We only use your email to deliver your report. No spam. No hard sales. No drip sequence. Just insights.